AI Report Generator: Turn Local Files Into a Finished Report

Anmol Singh
• • 6 min read
Meet Dume Cowork
A desktop AI agent that handles files, browser research, and reports end-to-end.
A finished report almost never starts as a report. It starts as a folder: a CSV exported from a dashboard, three pages of meeting notes, a vendor PDF, two screenshots someone dropped into chat, and last month's version of the same document that everyone agrees is the template. Turning that pile into something you can send takes most of an afternoon — and barely any of it is spent thinking.
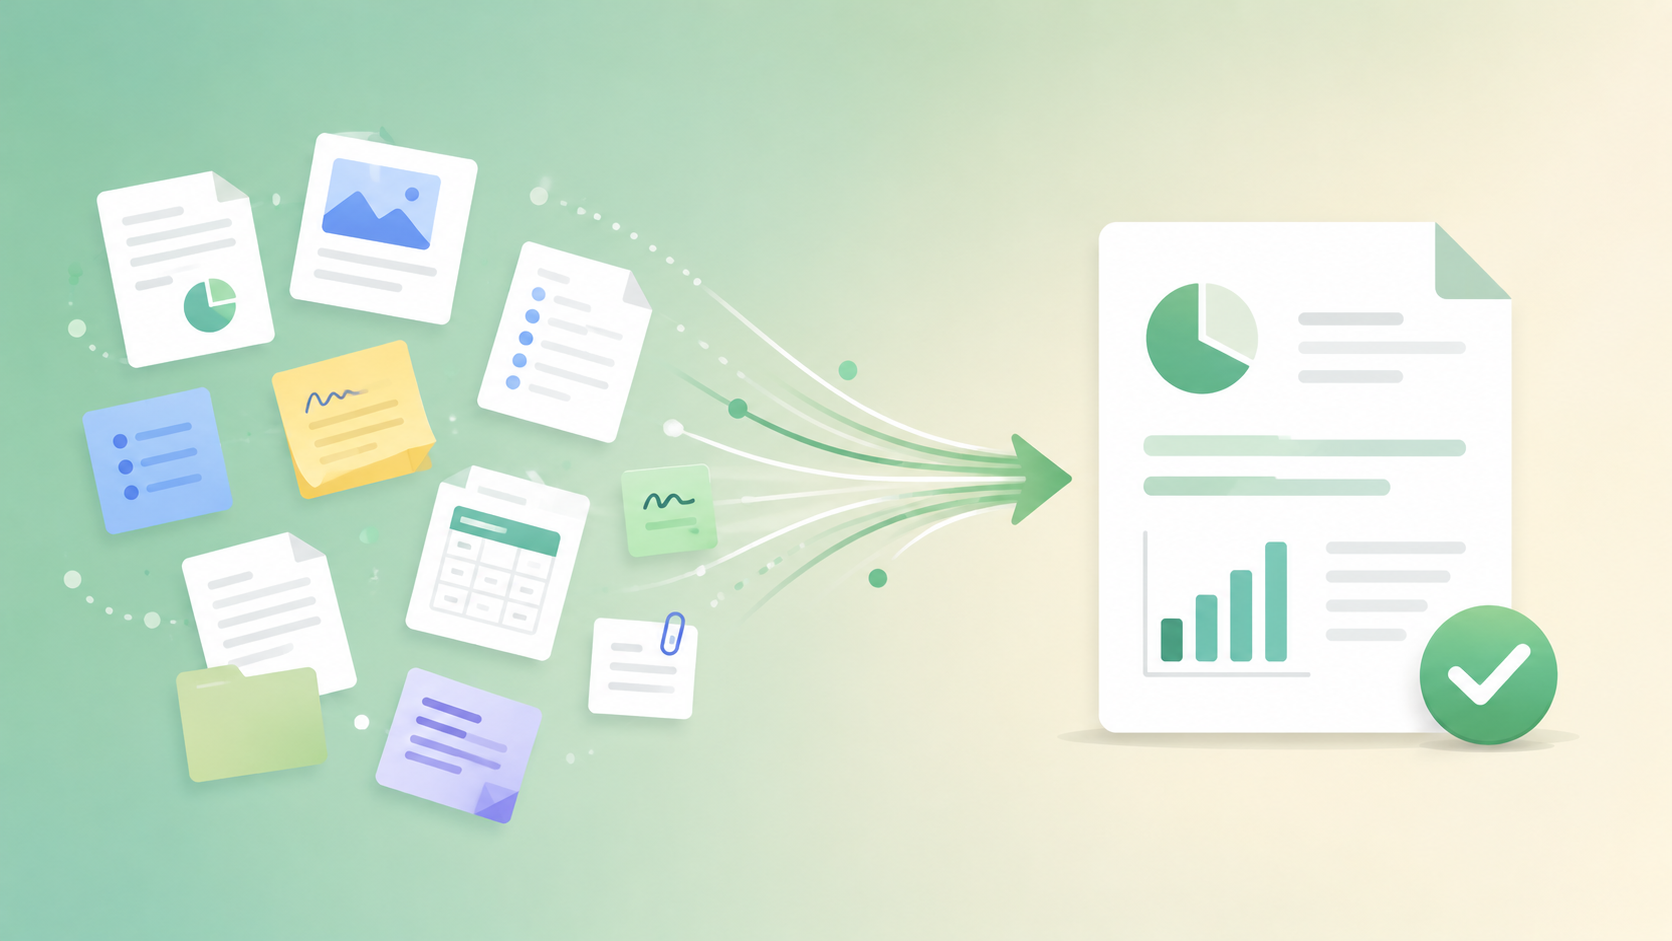
An AI report generator collapses the assembly step. You point it at the folder, tell it what the finished report should look like, and it reads every file, pulls out the numbers and findings that matter, and writes them into a document that follows your structure. Here's how that works with Dume Cowork, what “matching your template” really means, and the parts that still need you.
Key Takeaways
- Managers at small and mid-size businesses spend about 8.4 hours a week on reporting and data compilation (Salesforce State of Sales data via TechBasics, 2026).
- An AI report generator reads a folder of mixed files — spreadsheets, notes, PDFs, screenshots — and writes a draft following a template you supply.
- “Matching your template” means matching section order, table columns, and phrasing conventions — not fonts, colors, or pixel-perfect brand design.
- Setup takes about ten minutes: point it at a folder, hand it a past report as the template, then review the first draft against the sources.
- Charts, brand styling, and any sentence that explains “why” still need a human pass before the report goes out.
The Manual Process This Replaces
Managers at small and mid-size businesses spend an average of 8.4 hours a week on reporting and data compilation (Salesforce State of Sales data via TechBasics, 2026), and manual reporting consumes 20 to 40 percent of team time at mid-market companies (Datasive, 2026). Very little of that is analysis. It's retrieval, retyping, and reformatting.
The routine repeats itself in every function. Open the export, find the numbers that belong in the summary, copy the heading structure from last month's document, paste the figures into a table, calculate the change against the prior period, and rewrite a paragraph you've already written eleven times.
The hunting is the expensive part. Employees spend roughly 21 percent of their work time searching for information and another 14 percent recreating information they couldn't find (Harvard Business Review data via Agility Portal, 2026). On a report, both halves show up at once: you hunt for the file, fail to find the right version, and rebuild the table from scratch.
None of that requires expertise — just a free afternoon, which is exactly why reports slip to Friday and then to Monday. The thinking part usually takes twenty minutes once the document is assembled.
How It Works
Take a monthly client performance report at a small marketing agency. The working folder holds seven files: a GA4 sessions-and-conversions export as CSV, an ad spend spreadsheet, a Word file of notes from a mid-month client call, a PDF of the client's own sales figures, two dashboard screenshots, and last month's finished report as a .docx.
Dume Cowork opens all seven. It reads the tabular files as data, runs OCR on the screenshots and the PDF, and treats the call notes as context. Last month's report becomes the template — not content to copy, but a specification for what the new document should look like.
Here's what “matching your template” covers in practice: the section order (Summary, Channel Performance, Spend and Efficiency, Notable Events, Next Month), the heading levels under each one, your performance table's columns and their order, the length you normally give each section, and your phrasing conventions — that percent change always goes in parentheses after the raw number, and no metric ever appears without the prior period beside it.
What it doesn't cover is visual design. Fonts, brand colors, the cover page, and chart styling are layout, not structure. The draft carries your document's shape and voice; you apply the skin.
The output is a draft with real values already in place. The Summary opens with July sessions and conversions against June. The Channel Performance table is populated from the GA4 export with the spend column joined in from the ad spreadsheet. Notable Events pulls the line from the call notes about a campaign being paused for six days. Every figure keeps a pointer back to the file and cell it came from, so a number that looks wrong is one click from its source.
Anything the sources can't answer is left as a flagged gap rather than filled in. If the PDF's sales figures cover a different date range than the GA4 export, that shows up as a note instead of a quietly incorrect comparison.
Setting It Up
Getting from a folder of raw material to a first draft takes about ten minutes the first time, and under a minute every time after:
- Install Dume Cowork on Mac or Windows and sign in.
- Put the source files for one report into a single folder. Mixed formats are fine — CSV, XLSX, DOCX, PDF, and images can all sit together.
- Add a finished version of the report you want to match. A real past report works better than a blank template, because it shows tone as well as structure.
- Choose “Generate report,” name the output, and pick a format — Word, Google Docs, or Markdown.
- Review the first draft against the sources. Correct anything that reads wrong, and note any structural rule it missed so you can state that rule explicitly next time.
- Save the setup. Next month, drop new files into the same folder and regenerate — the template and your corrections carry over.
The second run is where the savings land. The first draft teaches the tool how you write; every draft after that starts from what you fixed.
What Still Needs a Human Touch
An AI report generator is reliable at assembly and unreliable at judgment. Knowing which is which is the difference between saving six hours and sending a client something embarrassing.
Charts are the clearest limit. Dume Cowork builds the table and describes the trend in a sentence, which is usually enough for an internal update. A chart matching your brand palette and annotation style still needs a manual build, or you drop the extracted numbers into a chart template you already own.
Brand styling is a layout job. Typefaces, color, cover pages, running headers, and page numbering all get applied after generation. The practical workflow is to generate into a document that already carries your styles rather than restyling a plain one.
Causal claims need you. The draft can say conversions fell 18 percent and that a campaign was paused for six days. It can't know the drop was actually caused by a checkout bug mentioned on a call nobody wrote down. Wherever a report explains “why,” treat the generated sentence as a hypothesis to confirm.
Complex formatting degrades. Nested tables, footnotes, cross-references, and multi-level numbering are where generated documents most often need repair. Simpler structures come out cleaner.
A workable habit: verify every number in your first two reports against its source, then spot-check flagged figures and anything that changed direction. For work going to a board, a client, or a regulator, read it as an editor rather than an approver.
Frequently Asked Questions
Reports are the assembly end of a problem that starts earlier: source files scattered across a Desktop, a Downloads folder, and three project directories. If finding them is the harder half of your afternoon, see how AI File Organizer for Mac & Windows handles that. And when the source material is a stack of receipts or invoices rather than exports and notes, turning receipts and invoices into a clean spreadsheet with AI covers that workflow specifically. All three run inside Dume Cowork, the same AI agent working on the files already on your machine.
Meet Dume Cowork
A desktop AI agent that handles files, browser research, and reports end-to-end.